Focused Assessment with Sonography for HIV-Associated Tuberculosis (FASH)
Jesse M. Schafer MD
I. Introduction
- Roughly 10 to 15% of immunocompetent patients with tuberculosis (TB) develop TB in sites other than the lungs, or extrapulmonary site TB (EPTB).1-5
- 50% of people with HIV-TB co-infection will develop EPTB.1,2,4-6
- The developing world is most affected by these epidemics, where resources for diagnosis and treatment are limited.7-9
- In patients with HIV but without active pulmonary TB, sputum smears are unreliable and can be positive in as few as 3% of cases.3,10,11
- Chest x-ray is negative in up to 27% of cases of EPTB.12
- The Focused Assessment with Sonography for HIV-associated tuberculosis (FASH) exam was developed to systematically identify pathology associated with EPTB.
II. Indications
- The goal of this protocol is to identify pathology highly suggestive of EPTB, ie, abdominal free fluid, pericardial effusions, periaortic lymph nodes and splenic micro abscesses13-20 in patients with HIV from an area with a high prevalence of TB.
- Symptoms of EPTB are non-specific and include: dyspnea on exertion, weakness, fever of unknown etiology, abdominal pain, weight loss.
- The FASH exam should be performed to evaluate for EPTB in the HIV-positive patient presenting with any of these non-specific symptoms from an area with a high burden of HIV and TB.
III. Anatomy (Fig. 1)
- The subxyphoid region is the surface landmark when looking for pericardial fluid. (Figure 1, #1)
- The area around the aorta is evaluated for lymph nodes, from the subxyphoid region to the umbilicus. (Figure 1, #2)
- The costal margins on the right and left are the surface landmarks when looking for free fluid in the hepatorenal and splenorenal recesses, pleural spaces superior to the diaphragm, and when evaluating for focal lesions in the liver or spleen. (Figure 1, #3 and #4)
- The pubic symphysis is the surface landmark that can be used to evaluate for free fluid in the pelvis. The most dependent area in the female pelvis will be between the uterus and the rectum (Pouch of Douglas) while in the male pelvis, the most dependent region is between the bladder and rectum. (Figure 1, #5)
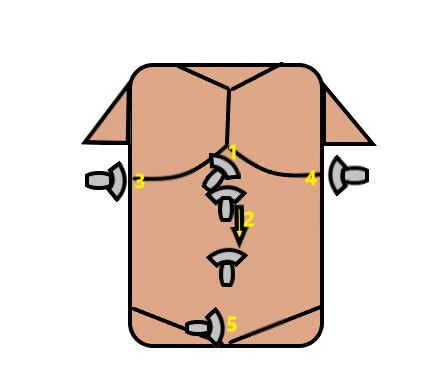
Figure 1. Anatomical regions for the FASH exam- (1) subxyphoid, (2) periaortic region, (3) right peri-diaphragmatic, (4) left peri-diaphragmatic, (5) pelvic
IV. Scanning technique with normal views
Scanning technique
- The 3.5mHz curvilinear transducer is appropriate for this scan
- A phased array or sector probe in the abdominal settings is also appropriate if a curvilinear transducer is unavailable in your setting.
- This scanning protocol incorporates views similar to the FAST exam.
- The high frequency linear transducer can also be used to identify small focal lesions in the spleen if this transducer is available.
Pericardial space:
- With the transducer in the subxyphoid region (Figure 1, #1), slightly right of midline with indicator to the patient’s right at a low angle (nearly flat with the skin) to evaluate for free fluid in the pericardium. Use the liver as a sonographic window. Be sure to adjust the visual field depth appropriately.
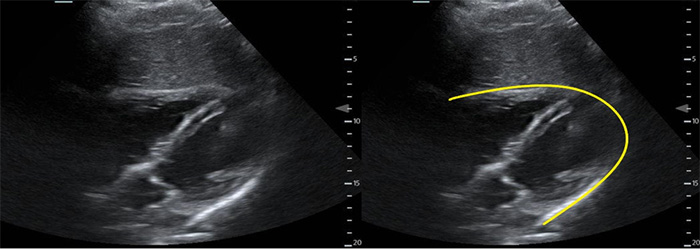
Figure 2. Subxyphoid cardiac view with pericardium highlighted
Video 1. Normal subxyphoid cardiac view
Periaortic region
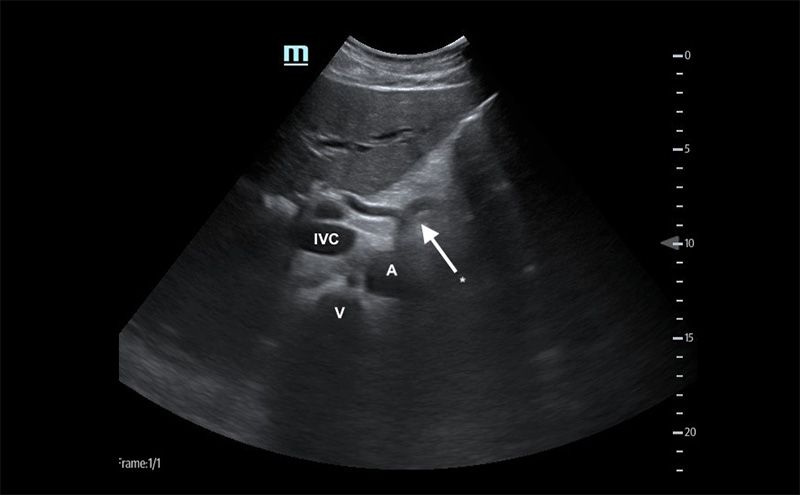
- With the transducer in the subxyphoid region, transducer in the transverse plane, evaluate the periaortic region for large lymph nodes. (Figure 1, #2)
- Identify the arch of the vertebral body in the far field then the aorta just to the patient’s left.
- Identify the “seagull sign” of the celiac trunk and slide the transducer inferiorly to the bifurcation of the common iliac arteries.
- Normally, lymph nodes will be difficult to visualize because they are small and normally hypoechoic with a hyperechoic central hilum. As they enlarge, the architecture is distorted, and they develop a homogeneous echotexture. Attempt to image lymph nodes in 2 planes and measure the diameter.
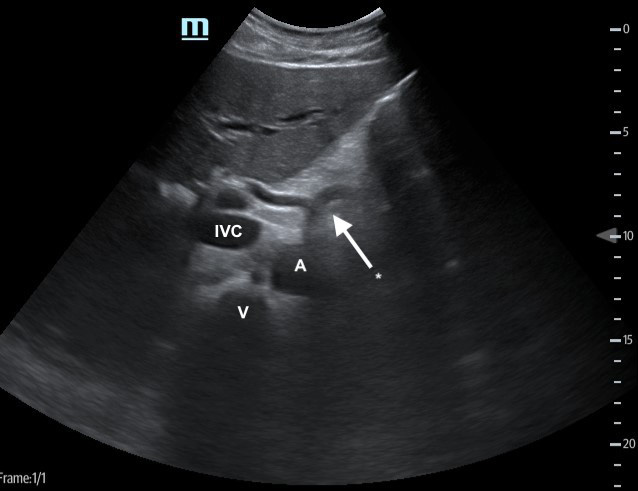
Figure 3. Proximal aorta (A) with celiac trunk "seagull sign" (*) adjacent to the IVC and vertebral body (V)
Right peri-diaphragmatic region:
- With the transducer in a coronal plane around the right costal margin, (Figure 1, #3) transducer indicator to the patient’s head, evaluate the hepatorenal recess (Morison’s Pouch) for free fluid, slide the transducer inferiorly to image the liver tip and the inferior pole of the kidney.
- Slide the transducer superiorly to image the right costophrenic recess for pleural fluid. (Video 2)
- Fan the transducer through the liver to evaluate for focal hypoechoic lesions
Video 2. Normal RUQ and pleural space
Left peri-diaphragmatic region:
- With the transducer in a coronal plane, around the left costal margin with transducer indicator to the patient’s head (Figure 1, #4), evaluate the splenorenal recess for free fluid. (Video 3)
Video 3. Normal LUQ
- Slide the transducer superiorly to image the left costophrenic recess for pleural fluid. (Video 4)
Video 4. Normal LUQ and left costophrenic angle with curvilinear probe
- Fan the transducer through the spleen to evaluate for focal splenic lesions.
- If no lesions are noted, switch to the high frequency linear transducer to evaluate the spleen for small focal hypoechoic lesions. (Video 5)
Video 5. Normal spleen with linear probe
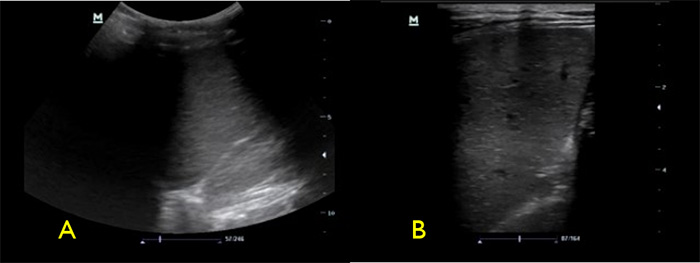
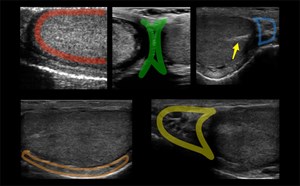
Figure 4. Spleen with low frequency (A) vs high frequency (B) transducers
Pelvic region:
- With the transducer in the sagittal plane, indicator to the patient’s head, place the heel of the transducer on the pubic symphysis, angled inferiorly. (Figure 1, #5)
- The bladder should be visualized in the sagittal plane with appropriate depth to identify the recto-uterine space in the female pelvis and the recto-vesicular space in the male pelvis. Fan through the pelvis in the sagittal plan and the transverse plane looking for free fluid. (Video 6)
Video 6. Normal female pelvis in sagittal plane
V. Pathology
Pathologic ultrasound findings in the FASH exam with available odds ratio (OR), positive predictive values (PPV) and negative predictive values (NPV):
- Pericardial effusion that may or may not contain fibrinous debris: OR = 2.821
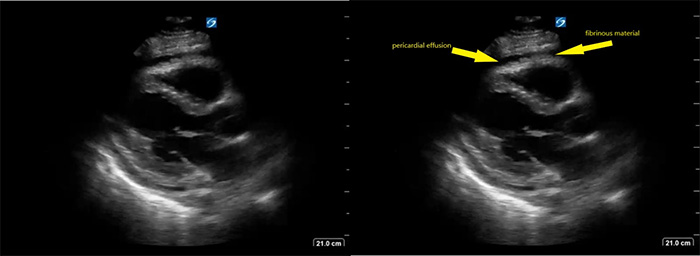
Figure 5. Parasternal long axis view of heart with fibrinous pericardial effusion
Video 7. Parasternal long axis view of heart with fibrinous pericardial effusion
-
- In one study of patients with HIV and large pericardial effusions, 69.5% had EPTB as a cause of the effusion.22
- Periaortic lymph nodes greater than 1cm: OR = 2.6, 21 PPV = 69%, NPV= 27%18
- Periaortic lymph nodes can be hard to identify. As they enlarge, they are easier to see and often lose their central hyperechoic region (hilum). As you scan through a lymph node, they will appear to grow then shrink because of their spherical shape.

Figure 6. Numerous periaortic lymph nodes
Video 8. Proximal aorta with multiple enlarged periaortic lymph nodes
- Ascites (Fig. 6)
- Ascites is a common finding in many disease entities however in the patient with HIV from a TB endemic area, it is highly suggestive of TB.
- With or without fibrinous debris: OR 2.221
- Without fibrinous stranding: PPV= 73% NPV = 33%18
- With fibrinous stranding: PPV = 86% NPV= 41%18
- Ascites is a common finding in many disease entities however in the patient with HIV from a TB endemic area, it is highly suggestive of TB.
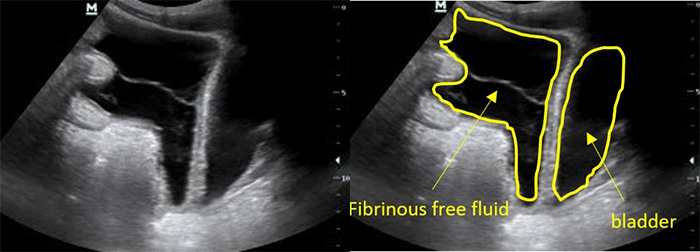
Figure 7. Fibrinous ascites in pelvis sagittal view

Figure 8. RUQ free fluid with fibrinous stranding and hyperechoic liver lesions
- Splenic micro abscesses: OR 1.921 (Figures 7 and 8, Videos 9 and 10)
- Micro abscesses will appear as small hypoechoic lesions. As they become numerous, they can coalesce and enlarge.
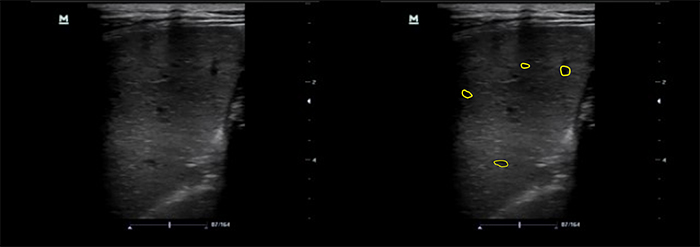
Figure 9. Spleen with microabscesses using linear transducer
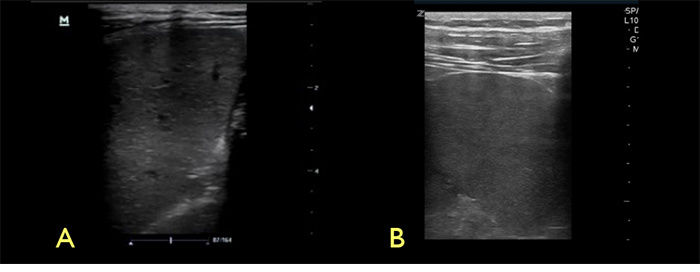
Figure 10. Spleen with high frequency linear transducer, A- microabscesses and granulomatous infiltration, B- normal spleen echotexture
Video 9. Spleen with microabscesses using low curvilinear probe
Video 10. Spleen with micro abscess using linear probe
- Hepatomegaly and hypo- or hyper-echoic lesions in the liver are commonly seen in HIV patients with EPTB but these findings are non-specific.23,24
- Pleural effusions may also be seen when evaluating the right or left peri-diaphragmatic regions (Videos 11 and 12).
Video 11. Right fibrinous pleural effusion
Video 12. Left pleural effusion and ascites
VI. Pearls and Pitfalls
- Patient history and clinical practice setting affect the test characteristics of this exam as free fluid can be found in a number of disease entities. Similarly, abdominal lymphadenopathy and focal lesions in the liver or spleen can be caused by infection or malignancy. However, in an area with a high burden of HIV and TB, this pathology is highly suggestive of disseminated TB.13-20
- In patients without HIV, these findings can be caused by non-TB entities such as cancer or other infectious diseases.25
- Focus on answering binary questions such as presence or absence of free fluid.
- If the heart is difficult to image from the subxyphoid region, move the probe to the left parasternal region in the 4th or 5th intercostal space.
- The descending aorta is the imaging landmark to help determine if free fluid is in the pericardial space or the pleural space when using the parasternal approach (Figure 11).
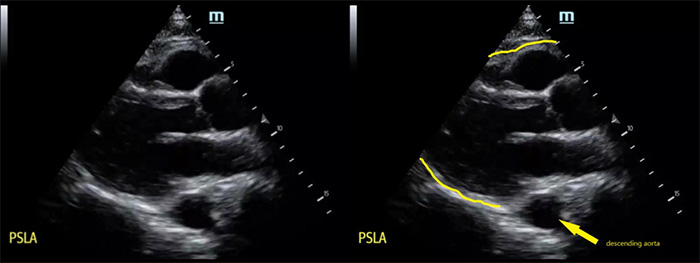
Figure 11. Parasternal long axis (PSLA) view of the heart without pericardial effusion, note descending aorta in the far field
- Free abdominal fluid will have irregular sharp edges as the fluid surrounds loops of bowel, while fluid contained in the bladder should have smooth rounded edges (Figure 7).
- The use of a high frequency linear transducer can improve your ability to identify splenic micro abscesses. 21,26-8 Freezing the image and scrolling manually can slow the image down enough to identify small micro abscesses (Figure 8).
VII. References
- Ade S, Harries AD, Trébucq A, et al. National profile and treatment outcomes of patients with extrapulmonary tuberculosis in Bénin. PloS One. 2014;9(4)e95603.
- Berg S, Schelling E, Hailu E, et al. Investigation of the high rates of extrapulmonary tuberculosis in Ethiopia reveals no single driving factor and minimal evidence for zoonotic transmission of Mycobacterium bovis infection. BMC Infect Dis. 2015;15:112.
- Kwanjana IH, Harries AD, Hargreaves NJ, et al. Sputum-smear examination in patients with extrapulmonary tuberculosis in Malawi. Trans R Soc Trop Med Hyg. 2000;94:395-8.
- Sandgren A, Hollo V, van der Werf MJ. Extrapulmonary tuberculosis in the European Union and European Economic Area, 2002 to 2011. Euro Surv. 2013;18(12) pii:20431.
- Rock RB, Sutherland WM, Baker C et al. Extrapulmonary Tuberculosis among Somalis in Minnesota. Emerg Infect Dis. 2006;12(9):1434-6.
- Sharma SK and Mohan A. Extrapulmonary tuberculosis. Ind J Med Res. 2004;120(4): 316-53.
- Corbett EL, Watt CJ, Walker N, et al. The growing burden of tuberculosis: global trends and interactions with the HIV epidemic. Arch Int Med. 2003;163:1009-21.
- World Health Organization. (2018) Global tuberculosis report 2018.World Health Organization. http://www.who.int/iris/handle/10665/274453. License: CC BY-NC-SA 3.0 IGO
- Perkins MD, Cunningham J. Facing the crisis: improving the diagnosis of tuberculosis in the HIV era. J Infect Dis. 2007;196 Suppl 1:S15-27.
- Harries AD, Hargreaves NJ, Kwanjana JH, et al. The diagnosis of extrapulmonary tuberculosis in Malawi. Trop Doct. 2003;33:7-11.
- Harries AD, Maher D, Nunn P. An approach to the problems of diagnosing and treating adult smear-negative pulmonary tuberculosis in high-HIV-prevalence settings in sub-Saharan Africa. Bull World Health Organ. 1998;76(6):651-62.
- Heller T, Goblirsch S, Bahlas S, et al. Diagnostic value of FASH ultrasound and chest X-ray in HIV-co-infected patients with abdominal tuberculosis. Int J Tuberc Lung Dis. 2013;17(3):342-4.
- Heller T, Wallrauch C, Goblirsch S, et al. Focused assessment with sonography for HIV-associated tuberculosis (FASH): a short protocol and a pictorial review. Crit Ultrasound J. 2012;4(1):21.
- Cegielski JP, Lwakatare J, Dukes CS, et al. Tuberculous pericarditis in Tanzanian patients with and without HIV infection. Tuber Lung Dis. 1994;75:429-34.
- Goblirsch S, Bahlas S, Ahmed M, et al. Ultrasound findings in cases of extrapulmonary TB in patients with HIV infection in Jeddah, Saudi Arabia. Asian Pac J Trop Dis. 2014;4(1):14-7.
- Pereira JM, Madureira AJ, Vieira A, et al. Abdominal tuberculosis: imaging features. Eur J Radiol. 2005;55(2):173-80.
- Sculier D, Vannarith C, Pe R, et al. Performance of abdominal ultrasound for diagnosis of tuberculosis in HIV-infected persons living in Cambodia. J Acquir Immune Defic Syndr. 2010;55(4):500-2.
- Sinkala E, Gray S, Zulu I, et al. Clinical and ultrasonographic features of abdominal tuberculosis in HIV positive adults in Zambia. BMC Infect Dis. 2009;9:44.
- Brunetti EL, Brigada RL, Poletti FL, et al. Die Rolle der Abdomen-Sonographie in der klinischen Betreuung von Aids-Patienten. Ultraschall In Der Medizin. 2006;27(1):20-33.
- dos Santos RP, Scheid KL, Willers DMC, et al. Comparative radiological features of disseminated disease due to Mycobacterium tuberculosis vs non-tuberculosis mycobacteria among AIDS patients in Brazil. BMC Infect Dis. 2008;8:24.
- Patel MN, Beningfield S and Burch V. Abdominal and pericardial ultrasound in suspected extrapulmonary or disseminated tuberculosis. S Afr Med J. 2011;101:39-42.
- Reuter H, Burgess LJ, Carstens ME, et al. Adenosine deaminase activity--more than a diagnostic tool in tuberculous pericarditis. Cardiovasc J S Afr. 2005;16(3):143-7.
- Terzic D, Brmbolic B, Singer D, et al. Liver enlargement associated with opportunistic infections in patients with human immunodeficiency virus infection. J Gastrointestin Liver Dis. 2008;17:401-4.
- Wetton CW, McCarty M, Tomlinson D, et al. Ultrasound findings in hepatic mycobacterial infections in patients with acquired immune deficiency syndrome (AIDS). Clin Radiol. 1993;47(1):36-8.
- Weber SF, Saravu K, Heller T, et al. Point-of-care ultrasound for extrapulmonary tuberculosis in India: A prospective cohort study in HIV-positive and HIV-negative presumptive tuberculosis patients. Am J Trop Med Hyg. 2018;98(1):266-73.
- Méndez N, Di Lonardo M, Sawicki M, et al. La ultrasonografía abdominal como método diagnóstico orientador en tuberculosis y/o micobacteriosis en pacientes H.I.V(Abdominal tuberculosis in patients with AIDS: US Findings). Rev Argent Radiol. 1995;59(2):87-91.
- Porcel-Martin A, Rendon-Unceta P, Bascuñana-Quirell A, et al. Focal splenic lesions in patients with AIDS: sonographic findings. Abdom Imaging. 1998; 23: 196-200.
- Murray JG, Patel MD, Lee S, et al. Microabscesses of the liver and spleen in AIDS: detection with 5-MHz sonography. Radiology. 1995;197(3):723-7.
