More Than Meets The Eye: Advanced Evaluation of Left Ventricular Systolic Function
Brian Makowski, DO
Chris Riwniak, DO
Cleveland Clinic Akron General
Case Presentation
A 69-year-old male presents to your rural emergency department with complaints of worsening dyspnea. The patient reports no significant past medical history, however mentions that he also has not seen a doctor in over 20 years. His initial vitals were notable for HR 110, BP 100/72, SpO2 of 84% on room air, and T98.6°F. You perform Thoracic POCUS for his undifferentiated dyspnea and find diffuse B-lines bilaterally in all lung fields consistent with pulmonary edema.
After stabilizing the patient’s respiratory status with BiPAP, you continue to evaluate the underlying etiology of your patient’s dyspnea and perform cardiac POCUS. As always, you systematically run through the “5 E’s” of focused echo to rapidly detect any potential life-threatening pathologies.1
- Effusion: no pericardial effusion present.
- Equality: RV:LV ratio appears normal.
- Exit: no aortic root dilatation noted.
- Entrance: IVC is >2.1 cm, plethoric, and with <50% respiratory variation.
- Ejection Fraction: LV systolic function appears mild to moderately depressed by visual estimation.
Following this rapid assessment, your suspicions for systolic heart failure are further raised. In order to obtain a current baseline, effectively monitor how your patient is responding to treatments, and communicate these findings to other members of the care team, you decide to perform several more advanced cardiac measurements.
Background
Heart failure encompasses a wide spectrum of pathologic states, with patient presentation often variable based on the underlying etiology. Heart failure with reduced ejection fraction (HFrEF) is a common subset of this population, with prevalence expected to increase by 46% between 2012 and 2030.2 Although visual estimation by the emergency department physician has been shown to provide a simple and accurate assessment of left ventricular systolic function, the rapid advances in point-of-care ultrasound (POCUS) technology through integration of smart functions or A.I. features introduces a potential for more easily performed quantitative left ventricular ejection fraction (LVEF) evaluations.3 While these functions are designed to simplify and aid the end-user, it remains pivotal to still understand the concepts behind these more advanced techniques. This newsletter serves as a brief overview on the various quantitative parameters of measuring LVEF and the fundamentals of their acquisition. E-Point Septal Separation (EPSS), Mitral Annular Plane Systolic Excursion (MAPSE), Fractional Shortening (FS), Fractional Area of Change (FAC), and Simpson’s Biplane Method are a few of the more common parameters and will be discussed below.
Visual Estimation of LV Systolic Function
Left ventricular visual estimation, the eyeball method, is the quickest and simplest way for emergency physicians (EP) to estimate LVEF. This method focuses on EP’s evaluating movement of the mitral valve during diastole as well as the walls of the LV during diastole and systole. This is commonly done with the parasternal long axis (PSLA), parasternal short axis (PSSA), and apical 4 chamber (A4C) views. EP’s have been shown to accurately assess LVEF as normal versus low.3 Given the subjective measure and lack of quantitative analysis, the eyeball method is arguably not the most accurate. Previous studies have demonstrated that competency for visual evaluation of decreased LVEF can be developed with a short 1 day training program and as few as 50 POCUS examinations.4,5
E-Point Septal Separation (EPSS)
EPSS is a measurement used to estimate the LVEF. It refers to the distance between the anterior mitral valve leaflet and the septum during early diastolic filling. It is a fairly simple measurement to obtain. To start, obtain a parasternal long axis (PSLA) view, ensuring that the interventricular septum and posterior LV wall appear horizontal on the screen. The operator will then use M-mode and place the cursor at the distal tip of the anterior mitral valve leaflet. The M-mode tracing will demonstrate 2 waves: an E-wave (1st & larger peak) and an A-wave (2nd & smaller peak). The distance between the top of the E-wave (E-point) and the septum is then measured. A normal EPSS is <7 mm. EPSS valves >7 mm have been shown to correlate with a LVEF <50% (Figure 1).
 Figure 1. E-point Septal Separation (EPSS) technique and normal values visual guide.
It is important to understand the limitations of performing this measurement. Underlying conditions that impact the function/movement of the mitral valve (mitral stenosis/repair/calcifications, aortic regurgitation, significant LV dilatation) can potentially cause a false elevation in your measurement, and EPSS should not be used when these conditions are present.
Additionally, one study on EPSS found a strong correlation (r = 0.78 to 0.82) in the quantitative prediction of LVEF compared to cardiac MRI imaging, utilizing the following equation: EF = 75.5 - (2.5 × EPSS (mm)).6
Mitral Annular Plane Systolic Excursion (MAPSE)
MAPSE is a measurement of the longitudinal displacement of the mitral annulus in relation to the left ventricular apex. To perform this measurement, first obtain an apical-four chamber (A4C) view that is focused on the left ventricle. The operator will then use M-mode and place the cursor through the lateral mitral annulus. It is important to have the cursor as perpendicular as possible to the lateral mitral annulus. M-mode will then generate a tracing that represents the displacement of the mitral annulus during the cardiac cycle. Measure this waveform from the nadir to the peak (Figure 2). MAPSE evaluates the longitudinal contraction of the LV which accounts for about 60% of stroke volume.7 MAPSE has previously been demonstrated to be specific but poorly sensitive for reduced LVEF. However, when added with visual estimation and EPSS, may perform better in combination.8
 Figure 2. Mitral Annular Plane Systolic Excursion (MAPSE) technique and normal values visual guide.
Fractional Shortening (FS)
FS measures the change in distance between the left ventricular walls during diastole and systole to estimate EF. To start, obtain a PSLA view. It is critical that the interventricular septum and posterior LV wall are horizontally oriented on the screen. Once this view is obtained, M-mode is selected and the cursor is placed in the middle of the LV chamber. Be sure not to include the valves or papillary muscles. Once a clip of the cardiac cycle is obtained, measure the tracing at the Left Ventricle End Diastolic Diameter (LVEDD) and the Left Ventricle End Systolic Diameter (LVESD). FS % = (LVEDD - LVESD)/LVEDD x 100 (Figure 3). It is important to recognize that FS % is not the ejection fraction, since it measures distance and not volume. The ultrasound can calculate the LVEF from this information or the Teicholz equation can be utilized to convert the FS% to an estimated LVEF. Many pitfalls and limitations exist for FS (must have normal LV geometry, no regional differences in contractile function, and normal ventricular activation), and for these reasons the American Society of Echocardiography no longer recommends the use of linear measurements for calculating LV volumes.9
 Figure 3. Fractional Shortening (FS) technique and normal values visual guide
Fractional Area of Change (FAC)
FAC measures the change in left ventricular area between diastole and systole to estimate LVEF. The operator will first obtain a PSSA view at the mid-papillary level. Freeze the image on screen, and scroll through to find the maximum area (left ventricle end diastolic area, LVEDA) and the minimum area (left ventricle end systolic area, LVESA). At each of these points, trace around the endocardial border of the LV, ensuring not to include the myocardium or papillary muscles. FAC% = (LVEDA - LVESA)/LVEDA x 100 (Figure 4). Like FS, FAC measures a change in area/distance and does not result in a value that is the LVEF, which is a measure of volume. LVEF can be estimated based on the FAC% value.10 Regional wall motion abnormalities, preload, and afterload can significantly influence FAC.
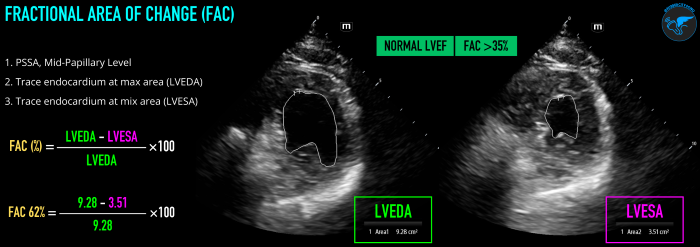 Figure 4. Fractional Area of Change (FAC) technique and normal values visual guide.
Simpson’s Biplane Method
Simpson’s Biplane is the currently the most accurate echocardiographic measurement of LVEF, and is the American Society of Echocardiography recommended method/gold standard of measurement of LVEF by 2D echo.9 However, it should be mentioned that it is the most operator-dependent technique and can be potentially difficult and time-consuming when first learning. Accuracy of measurement is dependent on image quality and relies on adequate visualization of the endocardial border. One must also ensure to avoid foreshortening of the LV, as this will cause an underestimate of the LVEF. Biplane refers to the utilization of this method at two different planes, the A4C and apical 2 chamber (A2C) views. The measurement of LV volume at different angles takes more aspects of LV geometry into account helping minimize and improve overall accuracy.
To obtain this measurement, start in an A4C view. Focus and zoom in on the LV cavity to optimize visualization of the left ventricle. Freeze your image and find when the LV is at end-diastole (mitral valve closed, largest LV size). Starting at the medial mitral annulus, trace around the endocardial border (aka the blood-tissue interface) until you reach the lateral mitral annulus. Do not include the papillary muscles or trabeculations in your tracing. The contour of the tracing will be closed by a straight line between your starting and ending points at the mitral annulus. LV length is then measured from the middle point of the straight line across the mitral annulus to the most distal point of the LV apex. The ultrasound machine will then divide the LV cavity into multiple disks and calculate the end-diastolic volume (EDV). Next, freeze your image at end-systole (aortic valve close, smallest LV size) and repeat the previously mentioned steps to obtain the end-systolic volume (ESV). Using the EDV and ESV measurements, LVEF can then be calculated (LVEF,% = [(EDV-ESV)/EDV]×100). Finally, obtain an A2C view by rotating ~60° from the A4C view. Obtain the EDV and ESV at the A2C using the same steps as above (Figure 5).
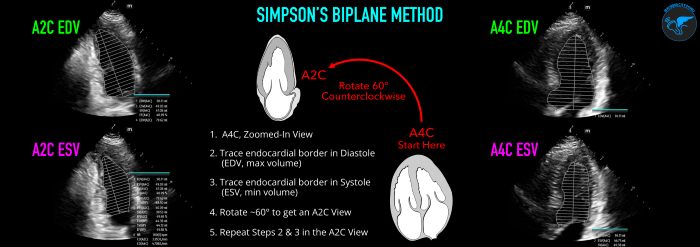 Figure 5. Simpson’s Biplane Method technique and normal values visual guide.
Newer ultrasound machines may now also come with integrated auto-intelligence (AI) package functions that can assist in determining LVEF (Figure 6). Although these AI tools are enticing to use due to their ease of use and rapid results, it is important to first understand the basics on performance of these measurements to identify any inconsistencies or errors the machine may be making.
 Figure 6. Example of AutoEF Plus Smart Tool on Mindray TE X Ultrasound System.
Case Resolution
After starting your patient on stabilizing measures, you perform these advanced cardiac measurements and find an EPSS of 13 mm and MAPSE of 7.5 mm. Using these numbers, you calculate an EF of 43% based on the EPSS (EF = 75.5 - (2.5 × EPSS (mm)), and EF of 41.8% based on the MAPSE (EF = 4.8 × MAPSE (mm) + 5.8). Feeling brave, you perform Simpson’s Biplane and calculate the LVEF to be 42%, which correlates to your EPSS & MAPSE findings for decreased LVEF. You implement treatment and discuss the case with your cardiology colleagues, including your concerns for systolic heart failure based on your imaging findings and admit him for further workup. The patient receives a radiology performed echocardiography the next day that shows LVEF of 40 ± 5% and he is diagnosed with HFrEF.
Discussion
While focused echocardiography can be used to rapidly rule-out potential underlying life-threatening conditions, expanded use in the point-of-care setting can be performed for a more extensive evaluation of a patient with signs of acute heart failure. Quantitative parameters can be utilized in combination with your initial visual estimation and confirm signs of decreased systolic function. If qualitative and quantitative measures of LVEF appear normal in a patient with clinical signs of acute heart failure, one may then consider further assessment with either diastology looking for diastolic heart failure or valvular assessment looking for signs of acute, severe structural heart disease. Combining other POCUS modalities can additionally be performed to further support your echo findings, such as lung ultrasound to assess for bilateral diffuse B-lines consistent with acute pulmonary edema.
Summary
- Emergency physicians can be competently trained in cardiac POCUS
- Various qualitative and quantitative techniques can be employed to estimate LVEF accurately
- When you are unsure of your visual estimation, consider using more advanced quantitative techniques to evaluate your suspicions
- Don’t rely on a single technique; recognize the individual limitations of each measurement and use multiple techniques to strengthen your evaluation
- When LVEF appears normal in a patient with clinical signs of acute heart failure, consider other advanced echo applications such as diastology or valvular assessments to find a potentially underlying pathology
- Consider combining cardiac and lung POCUS in your evaluation of critically-ill patients with respiratory distress
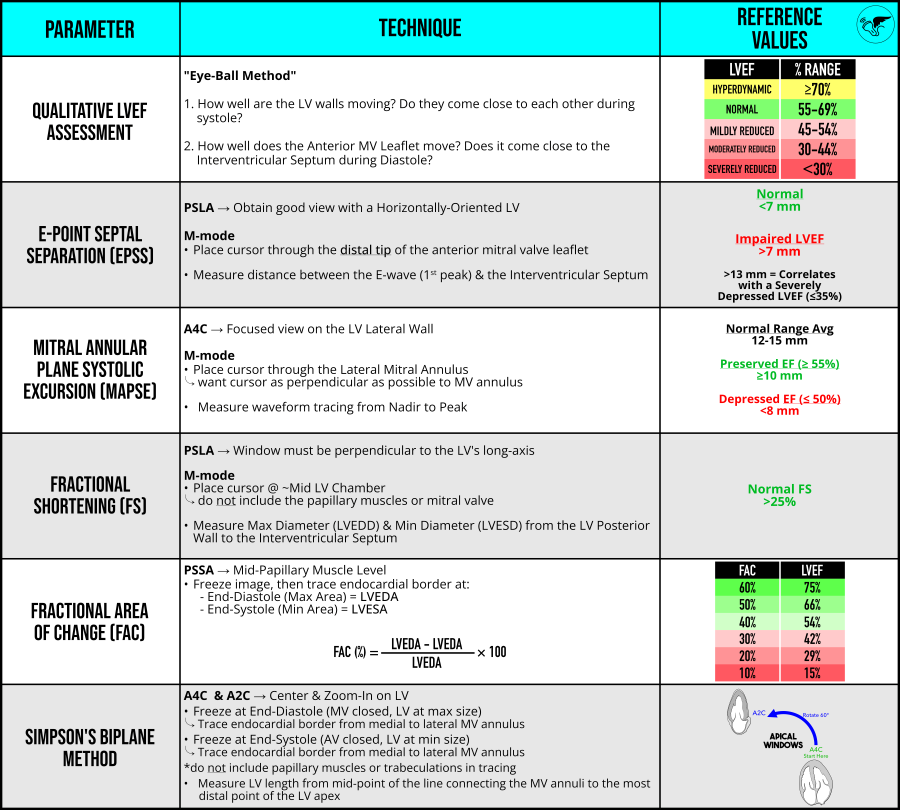 Figure 7. Quick guide summary table on advanced echo measures of left ventricular systolic function (LVEF)
More Resources:
- POCUS 101
- ECGWaves
- Show Me The POCUS
- CardioServ
References
- Kennedy Hall M, Coffey EC, Herbst M, et al. The "5Es" of emergency physician-performed focused cardiac ultrasound: a protocol for rapid identification of effusion, ejection, equality, exit, and entrance. Acad Emerg Med. 2015;22(5):583-593. doi:1111/acem.12652
- Kapelios CJ, Shahim B, Lund LH, Savarese G. Epidemiology, Clinical Characteristics and Cause-specific Outcomes in Heart Failure with Preserved Ejection Fraction. Card Fail Rev. 2023;9:e14. Published 2023 Nov 17. doi:15420/cfr.2023.03
- Unlüer EE, Karagöz A, Akoğlu H, Bayata S. Visual estimation of bedside echocardiographic ejection fraction by emergency physicians. West J Emerg Med. 2014;15(2):221-226. doi:5811/westjem.2013.9.16185
- Frederiksen CA, Juhl-Olsen P, Andersen NH, Sloth E. Assessment of cardiac pathology by point-of-care ultrasonography performed by a novice examiner is comparable to the gold standard. Scand J Trauma Resusc Emerg Med. 2013;21:87. Published 2013 Dec 13. doi:1186/1757-7241-21-87
- Gibson LE, White-Dzuro GA, Lindsay PJ, Berg SM, Bittner EA, Chang MG. Ensuring competency in focused cardiac ultrasound: a systematic review of training programs. J Intensive Care. 2020;8(1):93. Published 2020 Dec 11. doi:1186/s40560-020-00503-x
- Silverstein JR, Laffely NH, Rifkin RD. Quantitative estimation of left ventricular ejection fraction from mitral valve E-point to septal separation and comparison to magnetic resonance imaging. Am J Cardiol. 2006;97(1):137-140. doi:1016/j.amjcard.2005.07.118
- Carlsson M, Ugander M, Mosén H, Buhre T, Arheden H. Atrioventricular plane displacement is the major contributor to left ventricular pumping in healthy adults, athletes, and patients with dilated cardiomyopathy. Am J Physiol Heart Circ Physiol. 2007;292(3):H1452-H1459. doi:1152/ajpheart.01148.2006
- Schick AL, Kaine JC, Al-Sadhan NA, et al. Focused cardiac ultrasound with mitral annular plane systolic excursion (MAPSE) detection of left ventricular dysfunction. Am J Emerg Med. 2023;68:52-58. doi:1016/j.ajem.2023.03.018
- Lang RM, Badano LP, Mor-Avi V, et al. Recommendations for cardiac chamber quantification by echocardiography in adults: An update from the American Society of Echocardiography and the European Association of Cardiovascular Imaging. J Am Soc Echocardiogr. 2015;28(1). doi:1016/j.echo.2014.10.003
- Fractional Area Change (FAC). e-echocardiography. Accessed February 10, 2025. https://www.e-echocardiography.com/calculators/myocardial-performance/fractional-area-change-fac.